Rendering Business Capability, Data and Tech Alignment
Building the Prototype for Dynamic, Realtime Data Visualization
Our team used this project to prototype the io.datavisuals.com and ai.datavisuals.com engines used to power the first Data Visuals SaaS platform.
The goal was to enable real-time data feeds or file uploads to connect with data viz components interactively. This allows for instant rendering and updates to data visualizations. Say you were having a banner day on the exchange, or in the middle of an epic fund raiser. Connecting these results to your Data Visuals components allows your customers or key stakeholders to consume data results in near real-time!
The IO/AI project was a labor of love in way as it helped us to unlock the power of data visualization in a way that mere mortals can appreciate. We leverage a model that our founders were quite familiar with from the Enterprise Architecture world – the need to understand how organizations work, and how tech and data spend map to those business capabilities.
The project focuses on the intersection of a business capabilities, which model the high level business functions of any given company as well as the collection of technology and data assets in the company’s IT portfolio.
Visualize Your IT and Data Spend
Helping people to create dynamic business capability models goes a long way towards the goal of understanding tech and data costs by business function. It also helps leaders to interogate budget and spending allocations, track epics and hold each other accountable.
To that end, the project provided early adopters with the ability to create and upload up to 3 levels of business capabilities using industry specific CSV templates. These templates based upon common industry models like healthcare, automotive, insurance and retail would serve as a starting point to define the BCM model. For our project, we chose Automotive. The goal was (and remains) to help customers get a leg up on building out their capability model. This is now a free function available for anyone to use on the io.datavisuals.com Platform
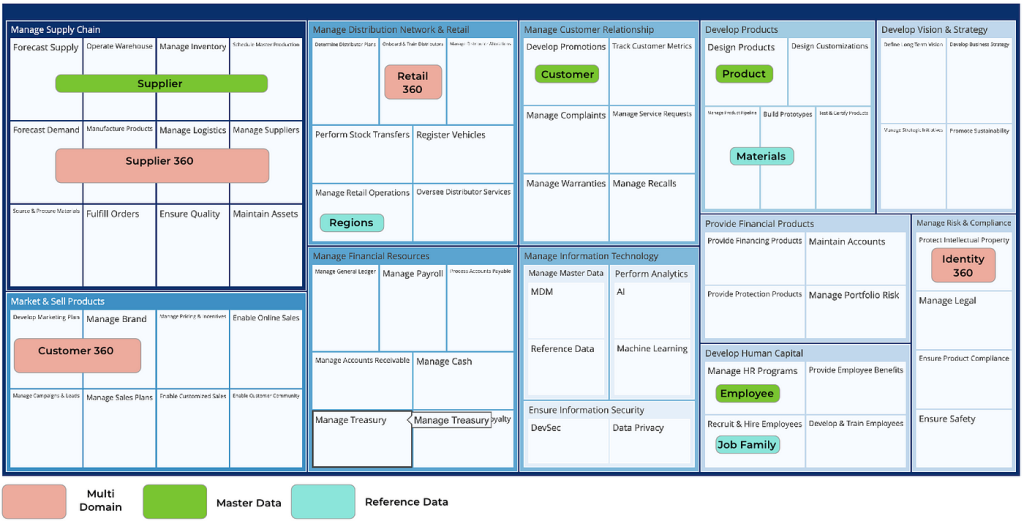
Figure 1: Data Visuals created dynamic Business Capability model with mapped data assets
Inventory and Aggregated Costs
Using the BCM as a foundation, users then associate an application and data asset inventory. The inventory is associated with BCM areas, along with an aggregate cost (subscription, maintenance, etc.). We then applied an algorythm to the data that was shared with us, to create a summary mapping of the stack costs to BCM, as shown in Figure 2:
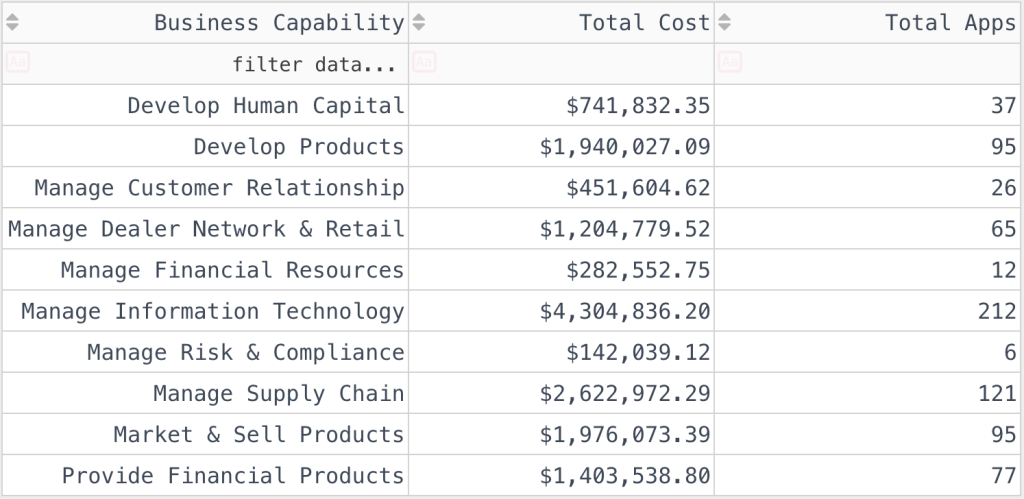
Figure 2: Apps with aggregate costs mapped to BCM
Visualize the Distribution
We decided to keep it simple as it related to application distribution. Simple pie charts seemed to be the most effective for customer’s targeting audience.
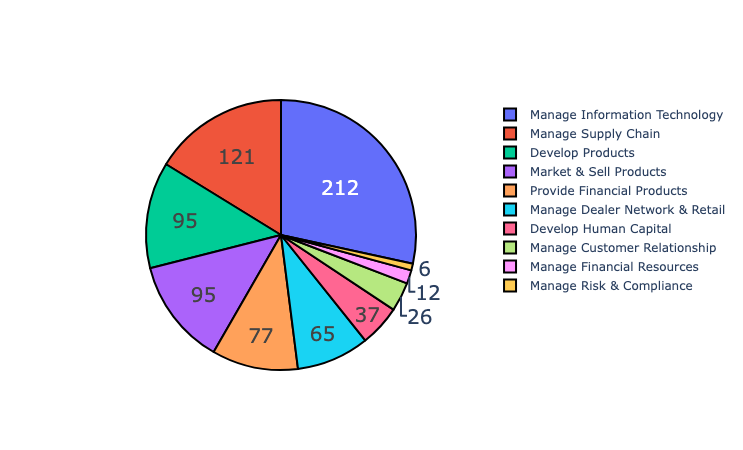
Figure 3: Application Distribution across all business capabilities
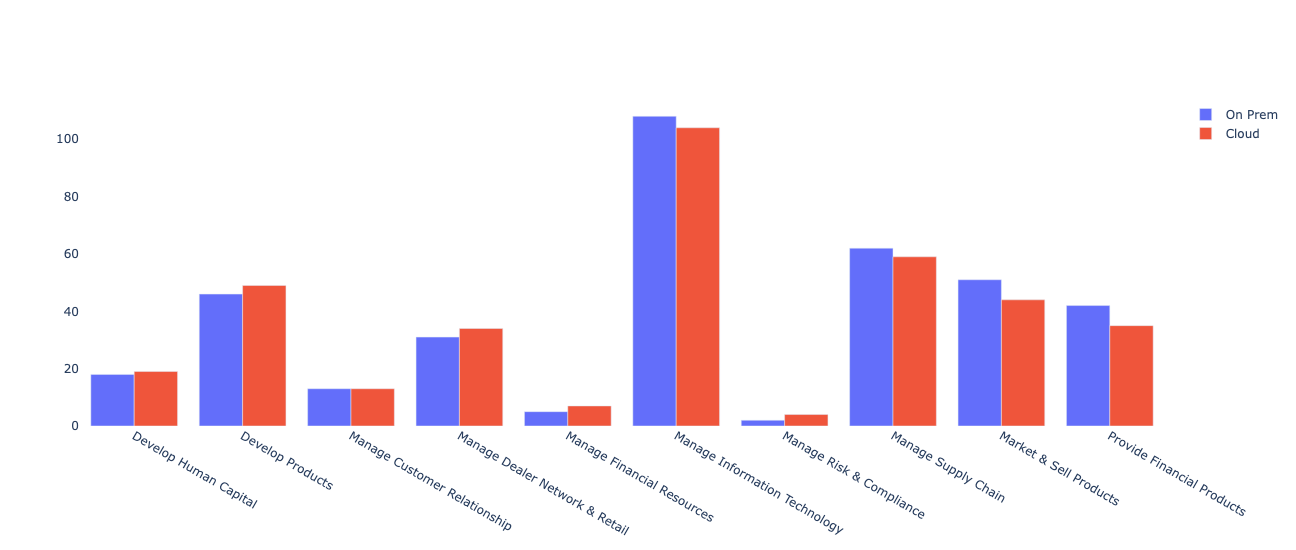
Understanding Cloud to OnPrem Mix
Once users had a viewpoint on the cost distribution, the addition of simple metadata to the dataset (Cloud, OnPrem) allows the CIO and her stakeholders to understand the deployment model mix by business function. Who’s leveraging the Cloud well?
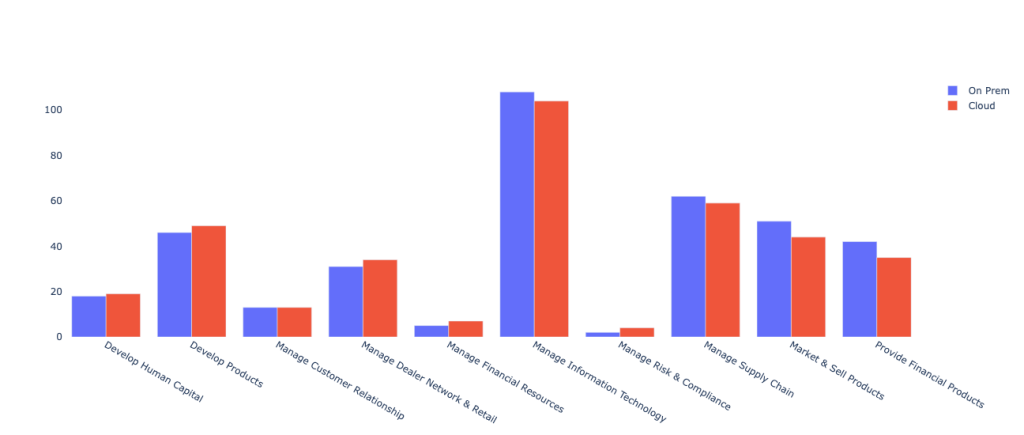
Figure 4: Cloud vs On Premise deployment mix